Visualizing Insights from Large Graphs: A Comprehensive Guide to Using G6VP and GraphScope
 GraphScope now supports serving as the backend engine for G6VP, an open-sourced graph visualization and analysis platform. With G6VP and GraphScope, users can import graph data and analyze graph data easily. This article mainly introduces how to deploy G6VP and GraphScope and perform data analysis.
What is G6VP
G6VP is a graph visualization and analysis platform developed by AntV Graph Visualization team of Ant Group. Users can connect their own data in G6VP, including local file uploads or various graph databases, and assemble the rich graph visualization and analysis assets provided by G6VP to perform data analysis, or design and develop their own graph visualization and analysis products, embedding them into their own systems.
Deployment of G6VP and GraphScope
Currently, G6VP supports GraphScope as a backend service. As G6VP does not have an available online server, the integration and deployment with GraphScope need to be based on Docker images. Currently, G6VP only supports the persistent graph storage (Groot) and graph interactive engine (GIE) in GraphScope. In the future, the docking of other storage and computation engines in GraphScope will be continuously completed, providing an efficient one-stop solution.
Image Deployment
In this step, you need to deploy the GraphScope service and G6VP HTTP service through docker images. It should be noted that the machine networks where the two services are located can be connected.
We first need to pull and start the image:
docker pull registry.cn-hongkong.aliyuncs.com/graphscope/graphscope-store:httpserver
# Start the Image, the port should be mapped in this procedure to ensure the availability of the service
# 12312 is the Gremlin's query port
# 9527 is the server port
docker run -d -p 12312:12312 -p 9527:9527 registry.cn-hongkong.aliyuncs.com/graphscope/graphscope-store:httpserver
After the GraphScope persistent storage (Groot) container is successfully started, the default dataset will be loaded. If you want to import your own dataset, please refer to the Groot documentation. You can execute the following command to check whether the container is running normally:
# Note that when the server is running the container, replace the localhost address with the server IP
curl http://localhost:9527/api/v1/graph
After successful deployment, the address of the GraphScope engine is http://localhost:9527, which will be used in the “Access GraphScope Service in G6VP” step later.
Start G6VP HTTP Service
There are two ways to start G6VP HTTP service:
Start directly using the binary installation package
You need to download gi-httpservices.tgz file, unzip gi-httpservice.tgz and enter the file folder to start the service. Before doing that, make sure the NodeJS environment is available on your computer.
cd gi-httpservice
# make sure port 7001 is available
lsof -i:7001
npm run start
Install and start from source code
You need to clone the source code of G6VP from GitHub, enter the folder G6VP/packages/gi-httpservice, install the dependencies, and start the service:
git clone https://github.com/antvis/G6VP.git
cd G6VP/packages/gi-httpservice
npm install
npm run dev
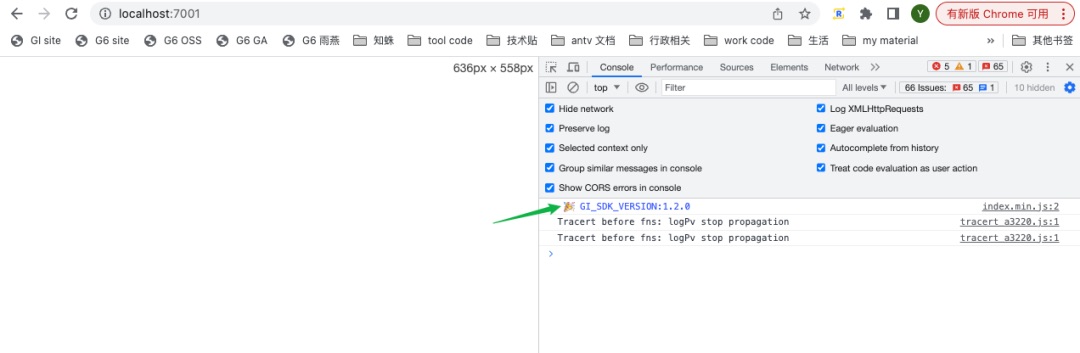
Now, G6VP http service is running, visit http://localhost:7001/ (7001 is the default port), you will see the tips in the console of browser:
Access GraphScope Service in G6VP
To connect GraphScope service, you need to fill the address of services from previous steps:
- Platform address: The address of G6VP HTTP service, it was
http://localhost:7001from the previous step - Engine address: The address of GS service, it was
http://localhost:9527from the previous step
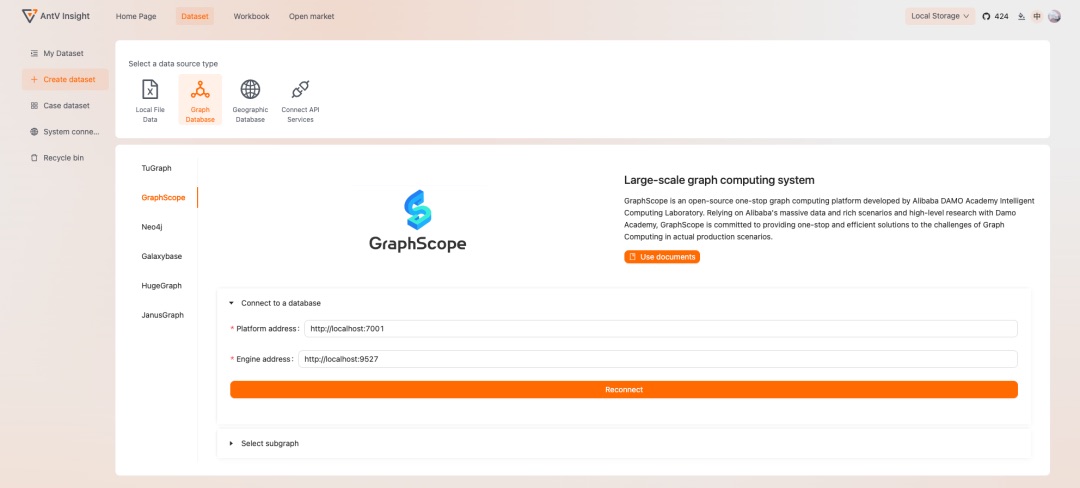
Click “Connect” button and you will see the tip if it is success, and the subgraph select panel will be shown at below:
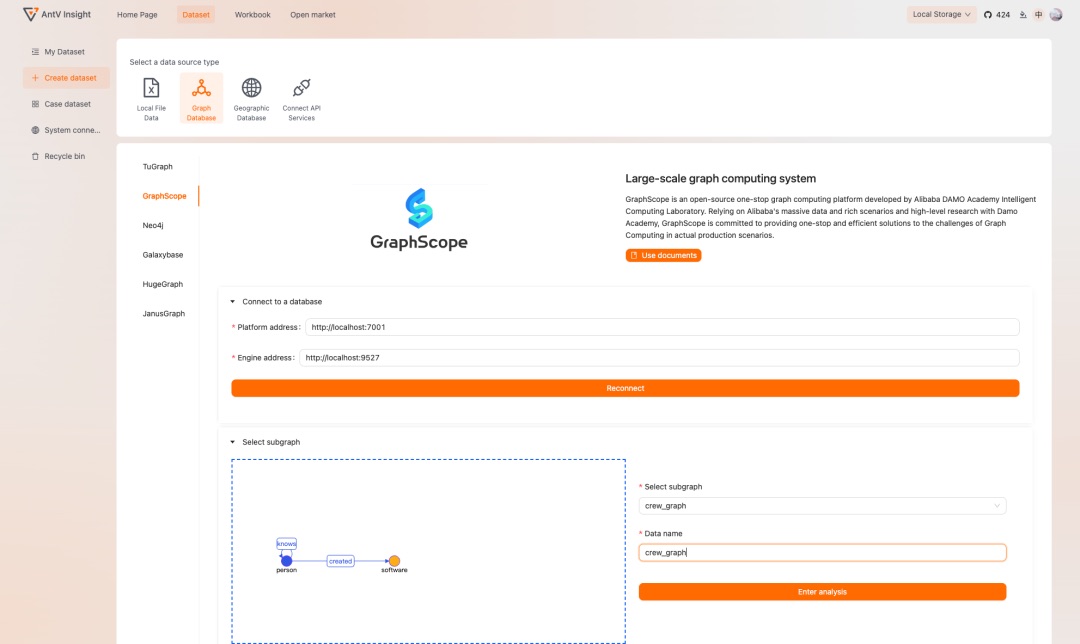
Next you can select a subgraph from “Select Subgraph”. This select dropdown has listed all the graphs in the GraphScope service you started. If there is no option, please checkout if the data importing step is failed. When you click “Analyze”, the page will jump to the list of the datasets, and you will find the dataset you just created:
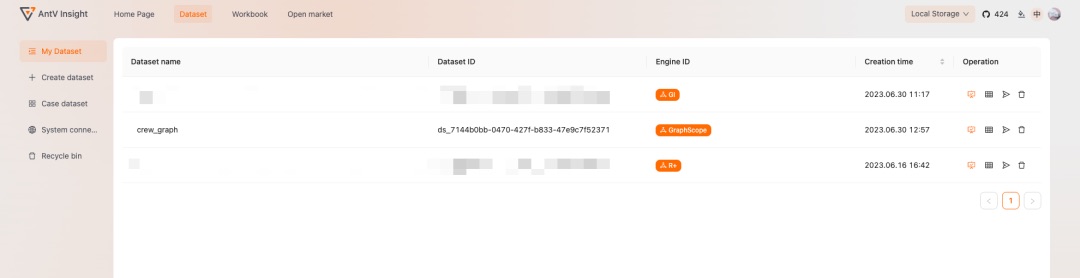
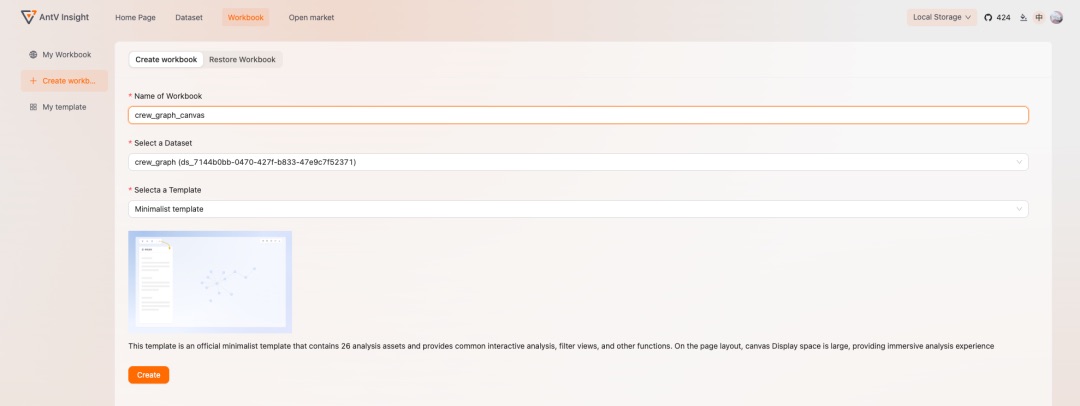
Now you can click the blue computer icon on the right of the dataset record in the list to create a workbook with the dataset. You will see the page below and the dataset field is already filled and please name the workbook and then click “Create Canvas”:
After that, a workbook is successfully created and you will see an empty canvas with configuration panel like this:
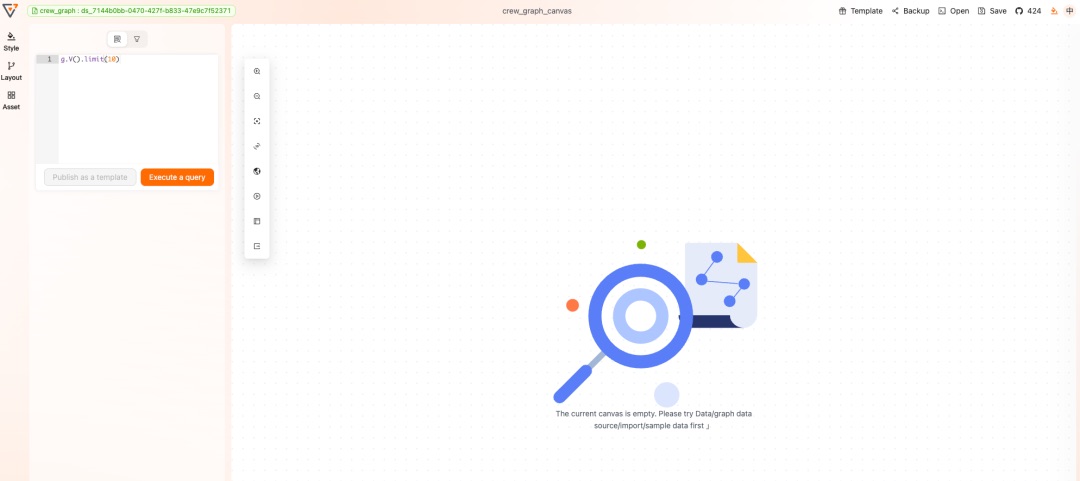
Analyze the Data
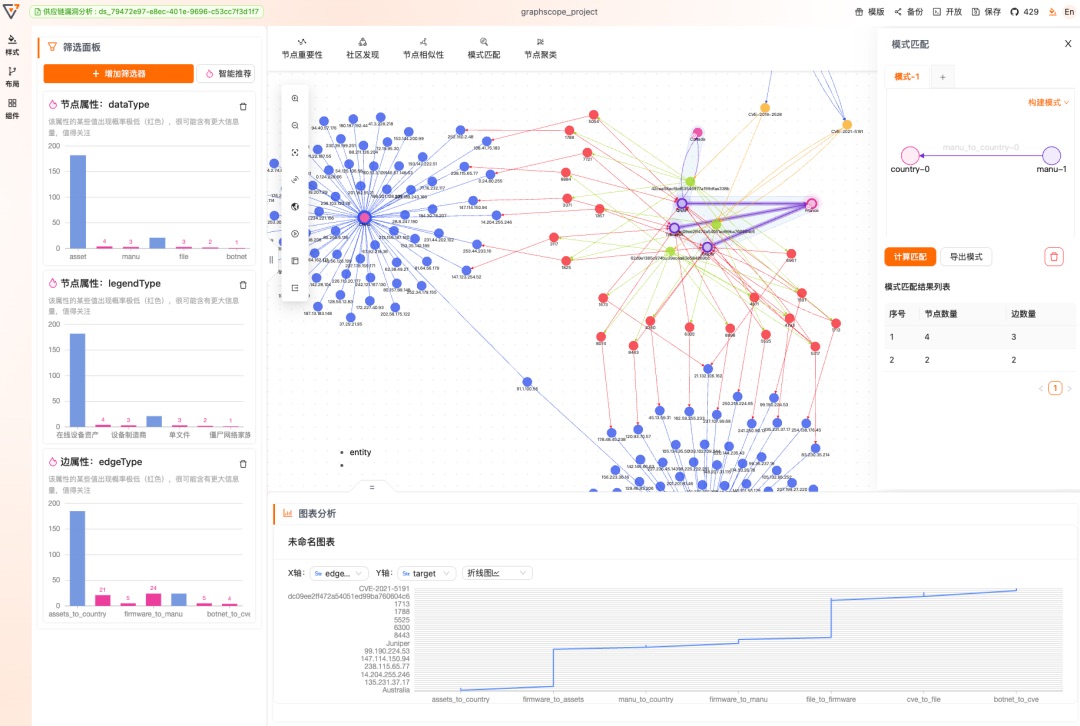
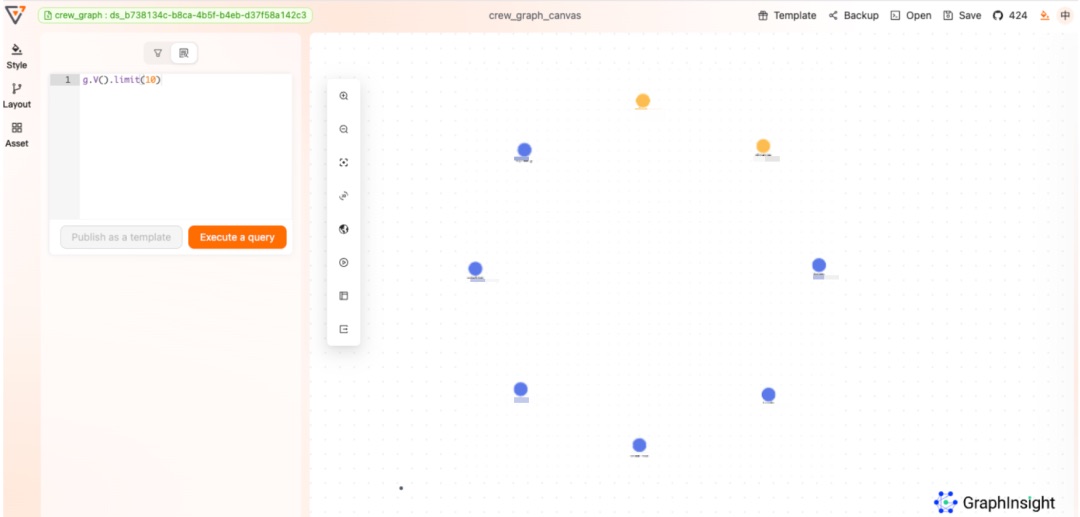
After the above steps, you have completed the connection to GraphScope and the creation of data and workbook. Then, you can perform data analysis in the newly created workbook. Now you can configure Gremlin query asset in the workbook, enter the Gremlin query statement, such as g.V().limit(10) in the figure below, to successfully query the data:
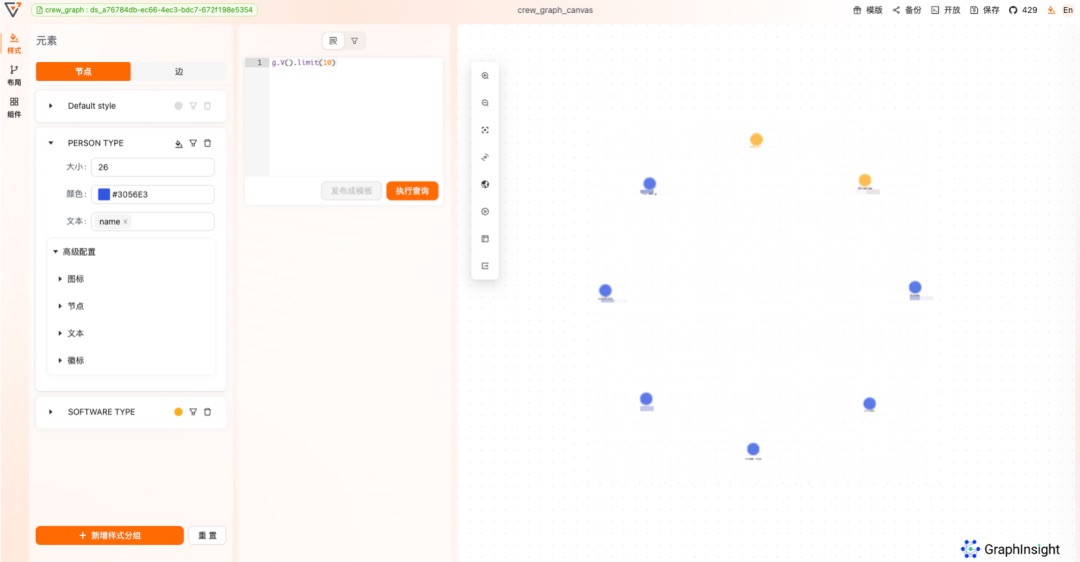
If you are not satisfy with the nodes and edges’ styles, configuring it on the style panel on the left:
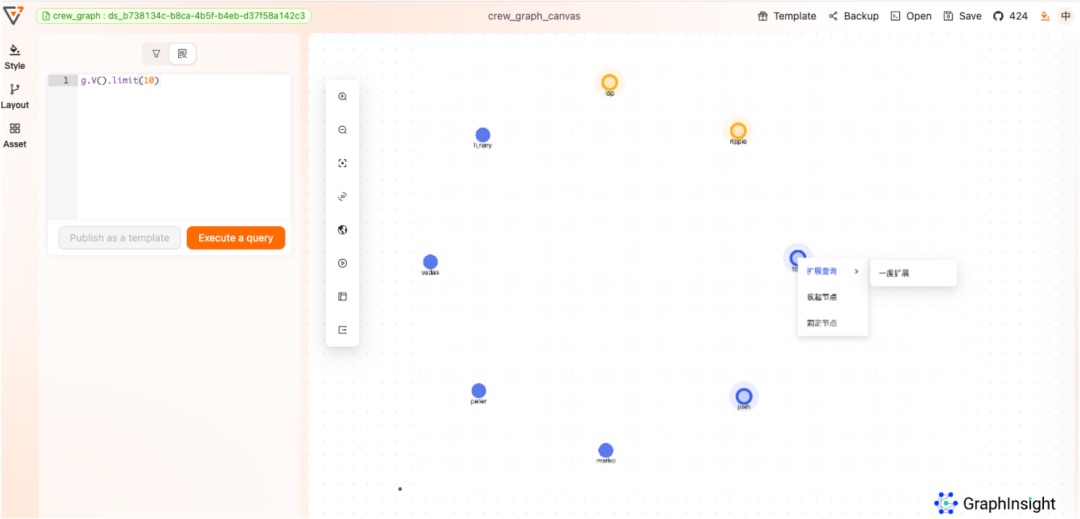
Select one or brush multiple nodes and right click to expand the neighbors:
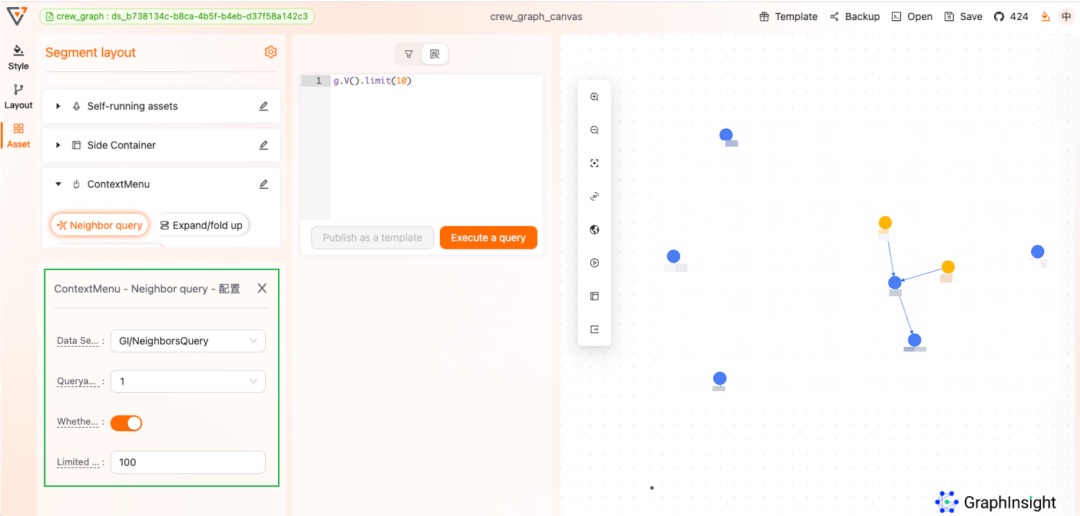
You can configure the neighbor querying asset on the left if it does not meet the requirement:
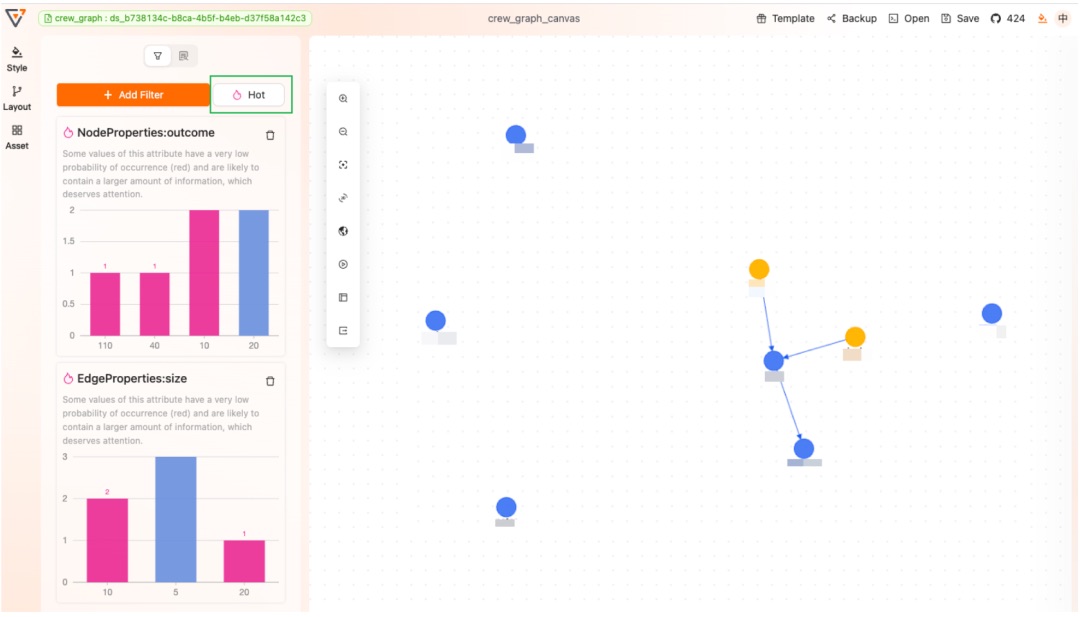
In addition, you can use the filter to analyze the statistical info, and there will be an intelligent recommend:
The introduction above is only about the basic functions. Plenty of fancy graph analysis assets will be found at the assets center.
Last but not least, do not forget to save your workbook after the above operations. Next time you visit G6VP, you will found your workbook at the workbook list. Don’t be worry, the datasets info, workbooks are all cached at your computer. G6VP will not record any user information!
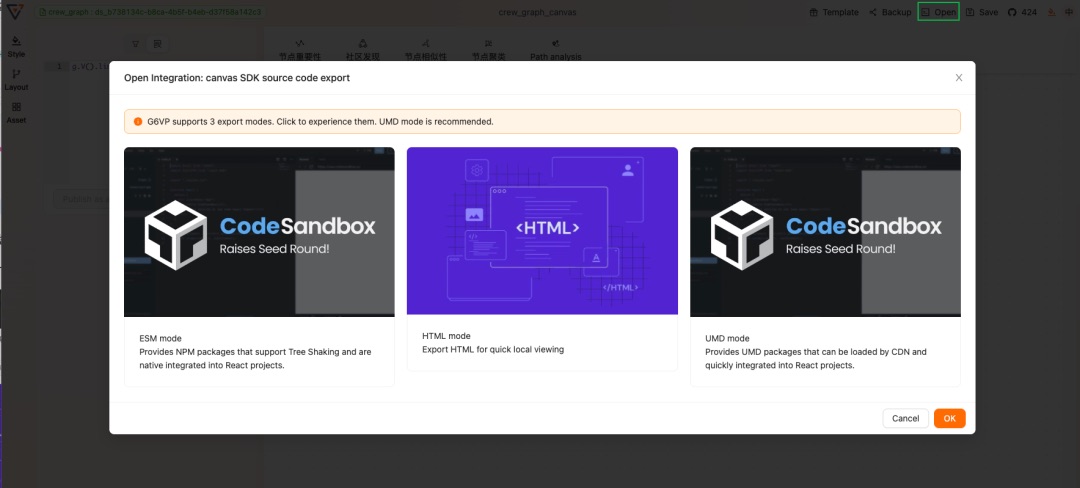
If you want to embed the workbook into your system, export it at the right top “Open”. There will be 3 ways to export:
More usage and docs can be referred to G6VP documentation and G6VP GitHub repo.