快速上手#
GraphScope 做为一站式图计算系统,可以处理图的交互式查询、图分析和图学习任务, 并且具有易于使用、高性能和良好的可扩展性等特点。
本章节将通过一个例子介绍如何基于 Kubernetes 使用 GraphScope 并帮助数据科学家来高效的分析大图。
示例: 论文引用网络中的节点分类任务#
ogbn-mag 数据集 是由微软学术关系图(Microsoft Academic Graph)的子集组成的异构图网络。 该图中包含4种类型的实体(即论文、作者、机构和研究领域),以及连接两个实体的四种类型的有向关系边。
我们需要处理的任务是,给出异构的 ogbn-mag 数据,在该图上预测每篇论文的类别。这是一个节点分类任务,该任务可以归类在各个领域、各个方向或研究小组的论文, 通过对论文属性和引用图上的结构信息对论文进行分类。在该数据中, 每个论文节点包含了一个从论文标题、摘要抽取的 128 维 word2vec 向量作为表征,该表征是经过 预训练提前获取的;而结构信息是在以下过程中即时计算的。

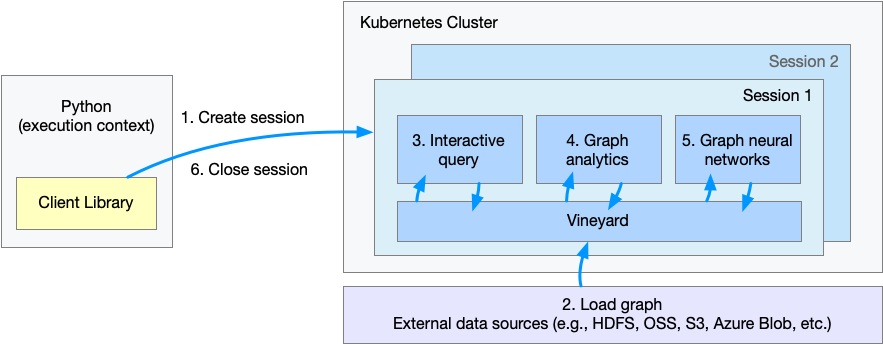
上图表示了用户通过 Python 客户端调用 GraphScope 解决该问题的工作流程。
步骤 1. 建立一个会话(session),为 GraphScope 创建一个工作空间;
步骤 2. 定义和载入图;
步骤 3. 通过 gremlin 交互式查询图;
步骤 4. 执行图算法做图分析;
步骤 5. 执行基于图数据的机器学习任务;
步骤 6. 关闭会话。
创建会话#
使用 GraphScope 的第一步,我们需要在 Python 中创建一个会话(session)。
import os
import graphscope

# assume we mount `~/test_data` to `/testingdata` in pods, and `ogbn_mag_small` within.
k8s_volumes = {
    "data": {
        "type": "hostPath",
        "field": {
            "path": os.path.expanduser("~/test_data/"),
            "type": "Directory"
        },
        "mounts": {
            "mountPath": "/testingdata"
        }
    }
}

sess = graphscope.session(k8s_volumes=k8s_volumes)
对于 macOS,创建会话需要使用 LoadBalancer 服务类型(默认是 NodePort)。
sess = graphscope.session(k8s_volumes=k8s_volumes, k8s_service_type="LoadBalancer")
另外,注意 data.field.path 是 Kubernetes 主机上的路径,当在 Mac 上使用 Docker-Desktop 时,需要首先将此路径加入到 Docker 的共享目录中,通常为 /Users。更详细的指引请参看 how to mount hostpath using docker for mac kubernetes.
会话(Session)的建立过程中,首选会在背后尝试拉起一个 coordinator 作为后端引擎的入口。 该 coordinator 负责管理该次会话的 所有资源(k8s pods),以及交互式查询、图分析、图学习引擎的生命周期。 在 coordinator 后续拉起的其他每个 pod 中,都有一个 vineyard 实例作为内存管理层,分布式的管理图数据。
载图 —
GraphScope 以属性图(property graph)建模图数据。属性图中,点和边都有一个标签(label),不同的标签有不同的属性(property)。 以 ogbn-mag 为例,下图展示了属性图的模型。

该图具有四种顶点,分别标记为“论文”、“作者”、“机构”和“研究领域”。有四种连接它们的边, 每种边都有一个标签,并且边的两端顶点的标签也是确定的。 例如,“引用”这种标签的边连接两个“论文”顶点。另一个例子是标记为“撰写”的边, 它要求该起始点的标记为“作者”,终止点的标记为“论文”。 所有的顶点 和边都可以具有属性。 例如,“论文”顶点具有诸如发布年份、主题标签等属性。
要将此图加载到 GraphScope,可以将以下代码与 数据文件 结合使用。 请下载数据并将其解压缩到本地的挂载目录(在本例中为`〜/test_data`)。
g = sess.g()
g = (
    g.add_vertices("paper.csv", label="paper")
    .add_vertices("author.csv", label="author")
    .add_vertices("institution.csv", label="institution")
    .add_vertices("field_of_study.csv", label="field_of_study")
    .add_edges(
        "author_affiliated_with_institution.csv",
        label="affiliated",
        src_label="author",
        dst_label="institution",
    )
    .add_edges(
        "paper_has_topic_field_of_study.csv",
        label="hasTopic",
        src_label="paper",
        dst_label="field_of_study",
    )
    .add_edges(
        "paper_cites_paper.csv",
        label="cites",
        src_label="paper",
        dst_label="paper",
    )
    .add_edges(
        "author_writes_paper.csv",
        label="writes",
        src_label="author",
        dst_label="paper",
    )
)
也可通过我们提供的内置数据集函数帮助完成载图流程:
from graphscope.dataset import load_ogbn_mag

g = load_ogbn_mag(sess, "/testingdata/ogbn_mag_small/")
需要注意的是,这里的 g 已经是一个分布式存储在 vineyard 中的图。图数据分布在这个会话背后拉起的 k8s pods 中。更多细节请查看 载图
交互式查询#
交互式查询允许用户以“探索性”方式来探索、查看和显示图数据, 以方便的定位和洞察特定的深入信息。GraphScope 采用称为 Gremlin 的高级语言进行图遍历,并提供大规模的高效执行。
在此示例中,我们使用图遍历来查看两位给定作者共同撰写的论文数量。为了简化查询,我们假设作者可以分别由ID 2 和 4307 唯一标识。
# get the entrypoint for submitting Gremlin queries on graph g.
interactive = sess.gremlin(g)

# check the total node_num and edge_num
node_num = interactive.execute("g.V().count()").one()
edge_num = interactive.execute("g.E().count()").one()

# count the number of papers two authors (with id 2 and 4307) have co-authored.
papers = interactive.execute("g.V().has('author', 'id', 2).out('writes') \
                .where(__.in('writes').has('id', 4307)).count()").one()
图分析#
图分析是在真实场景中被广泛使用的一类图计算。事实证明, 许多算法(例如社区检测,路径和连接性,集中性)在各种业务中都非常有效。 GraphScope 内建了一组预置常用算法,方便用户可以轻松分析图数据。
下面我们首先通过在特定周期内从全图中提取论文(背后基于 Gremlin!)来导出一个子图,然后运行 k-core 分解和三角形计数以生成每个论文节点的结构特征。
需要注意的是,由于许多算法可能仅适用于同构图(只有一类点和一类边而不区分标签),因此,要在属性图上使用这些算法,我们首先需要将其投影到一个简单的同构图中。
# exact a subgraph of publication within a time range
sub_graph = interactive.subgraph("g.V().has('year', gte(2014).and(lte(2020))).outE('cites')")

# project the projected graph to simple graph.
simple_g = sub_graph.project(vertices={"paper": []}, edges={"cites": []})

ret1 = graphscope.k_core(simple_g, k=5)
ret2 = graphscope.triangles(simple_g)

# add the results as new columns to the citation graph
sub_graph = sub_graph.add_column(ret1, {"kcore": "r"})
sub_graph = sub_graph.add_column(ret2, {"tc": "r"})
此外,用户还可以在 GraphScope 中编写自己的算法。当前,GraphScope 支持用户以 Pregel 模型和 PIE 模型自定义图算法。
图神经网络 (GNNs)#
图神经网络(GNN)结合了图结构和机器学习的优势,可以将图中的结构信息和属性信息压缩为每个节点上的低维嵌入向量。这些嵌入和表征可以进一步输入到下游的机器学习任务中。
在我们的示例中,我们训练了 GCN 模型,将节点(论文)分类为349个类别,每个类别代表一个出处(例如预印本和会议)。为此,接着上一步,首先需要启动学习引擎并构建一个具有特征的数据图。
# define the features for learning
paper_features = [f"feat_{i}" for i in range(128)]

paper_features.append("kcore")
paper_features.append("tc")

# launch a learning engine.
lg = sess.graphlearn(sub_graph, nodes=[("paper", paper_features)],
                   edges=[("paper", "cites", "paper")],
                   gen_labels=[
                        ("train", "paper", 100, (0, 75)),
                        ("val", "paper", 100, (75, 85)),
                        ("test", "paper", 100, (85, 100))
                   ])
然后我们定义一个训练过程并执行。
# Note: Here we use tensorflow as NN backend to train GNN model. so please
# install tensorflow.
try:
    # https://www.tensorflow.org/guide/migrate
    import tensorflow.compat.v1 as tf
    tf.disable_v2_behavior()
except ImportError:
    import tensorflow as tf

import graphscope.learning
from graphscope.learning.examples import EgoGraphSAGE
from graphscope.learning.examples import EgoSAGESupervisedDataLoader
from graphscope.learning.examples.tf.trainer import LocalTrainer

# supervised GCN.
def train_gcn(graph, node_type, edge_type, class_num, features_num,
            hops_num=2, nbrs_num=[25, 10], epochs=2,
            hidden_dim=256, in_drop_rate=0.5, learning_rate=0.01,
):
    graphscope.learning.reset_default_tf_graph()

    dimensions = [features_num] + [hidden_dim] * (hops_num - 1) + [class_num]
    model = EgoGraphSAGE(dimensions, act_func=tf.nn.relu, dropout=in_drop_rate)

    # prepare train dataset
    train_data = EgoSAGESupervisedDataLoader(
        graph, graphscope.learning.Mask.TRAIN,
        node_type=node_type, edge_type=edge_type, nbrs_num=nbrs_num, hops_num=hops_num,
    )
    train_embedding = model.forward(train_data.src_ego)
    train_labels = train_data.src_ego.src.labels
    loss = tf.reduce_mean(
        tf.nn.sparse_softmax_cross_entropy_with_logits(
            labels=train_labels, logits=train_embedding,
        )
    )
    optimizer = tf.train.AdamOptimizer(learning_rate=learning_rate)

    # prepare test dataset
    test_data = EgoSAGESupervisedDataLoader(
        graph, graphscope.learning.Mask.TEST,
        node_type=node_type, edge_type=edge_type, nbrs_num=nbrs_num, hops_num=hops_num,
    )
    test_embedding = model.forward(test_data.src_ego)
    test_labels = test_data.src_ego.src.labels
    test_indices = tf.math.argmax(test_embedding, 1, output_type=tf.int32)
    test_acc = tf.div(
        tf.reduce_sum(tf.cast(tf.math.equal(test_indices, test_labels), tf.float32)),
        tf.cast(tf.shape(test_labels)[0], tf.float32),
    )

    # train and test
    trainer = LocalTrainer()
    trainer.train(train_data.iterator, loss, optimizer, epochs=epochs)
    trainer.test(test_data.iterator, test_acc)

train_gcn(lg, node_type="paper", edge_type="cites",
        class_num=349,  # output dimension
        features_num=130,  # input dimension, 128 + kcore + triangle count
)
关闭会话#
最后,当我们完成所有的计算过程后,关闭当前的会话。该步骤会告知背后的 Coordinator 和引擎,释放当前所有的资源。
sess.close()